Quickstart
Take a dataset through a first analysis, inspect the results, and save the work. This walkthrough requires access to a working development build; public installers are not yet available.
Step 1: Open Mizura
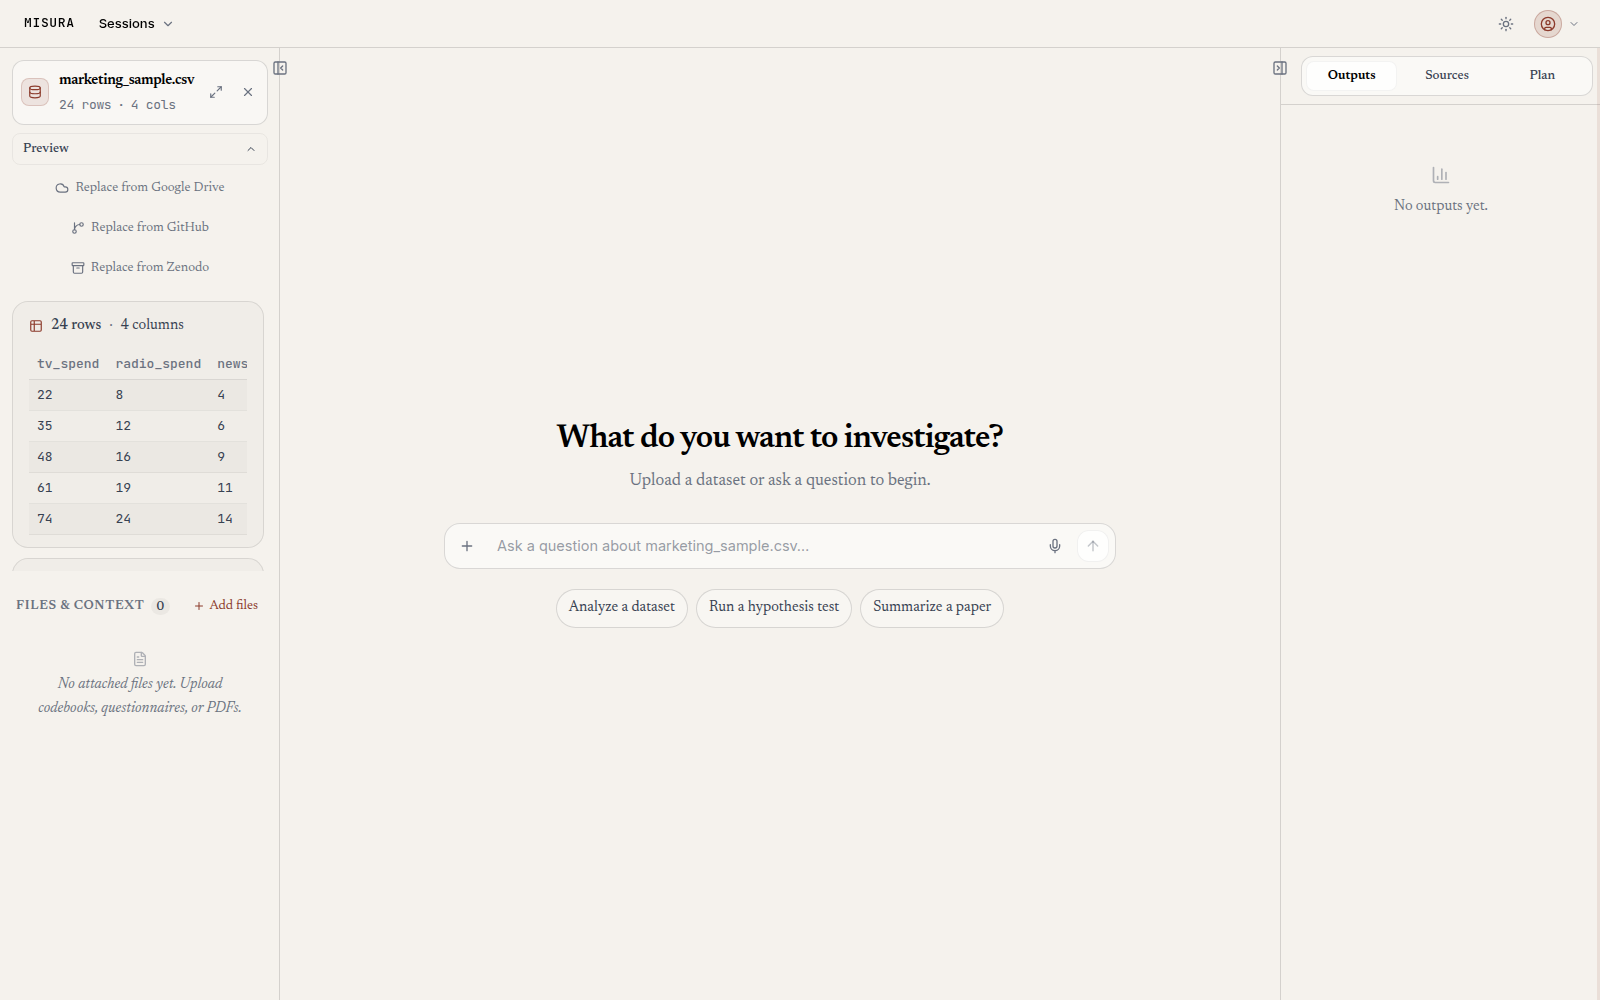
Launch the app. The workspace asks What do you want to investigate? No session exists yet. One is created the first time you send a message. That is the whole setup.
Step 2: Load a dataset
Drop a dataset file onto the workspace, or use the dataset panel on the left. CSV, Excel, Parquet, JSON, Stata .dta, and more. The full list is in Your data. Loading gives you an immediate preview: row and column counts, the first rows, and summary statistics for the numeric columns.
Try a small example
Download first-analysis.csvand load it as a dataset. It contains 24 synthetic observations withobservation, group, spend, andsales columns, with no missing cells. These values are for learning the workflow and support no real-world research conclusion.
Inspect this synthetic dataset. Confirm the row count, column types, and missing values. Plot sales against spend and describe the observed association. Print the descriptive statistics you use. Do not claim causation or change the dataset.Success means you can find a data summary, the requested plot, and the Python that produced the numbers. Confirm the preview has 24 rows and four columns. If the agent reports another size, check the file and active dataset before proceeding. Generated wording and plot styling can vary between runs.
For a deterministic check, download the sandbox Python exampleand inspect it before asking Mizura to run that exact code with the sample dataset. It creates a descriptive table and scatter plot and prints 24 rows, mean spend 47.5, and mean sales 49.5. This script uses Mizura's injected data, save_table, andsave_figure helpers; it is not a standalone Python program. Generated prose can vary, but these computed values should match.
Step 3: Ask a question
Plain language, English or Arabic. Say what you want and what you want back:
Does monthly sunspot activity follow a seasonal pattern?
Fit an appropriate time-series model and report the evidence.
Mention the outcome and predictors. Mention the population or time window. Say whether you want a test, an estimate, or a plot. Name any decision you have already made, like a significance level or a reporting style. Attachments go in with the + button, by dragging, or by pasting. Five per message at most. Codebooks, questionnaires, and PDFs count as context, not datasets.
While the agent works you see the thinking trace, the tool calls, the live Python in the sandbox panel, and the answer streaming in. Workflow & plans covers the workspace in full.
Step 4: Review the plan, then press Go
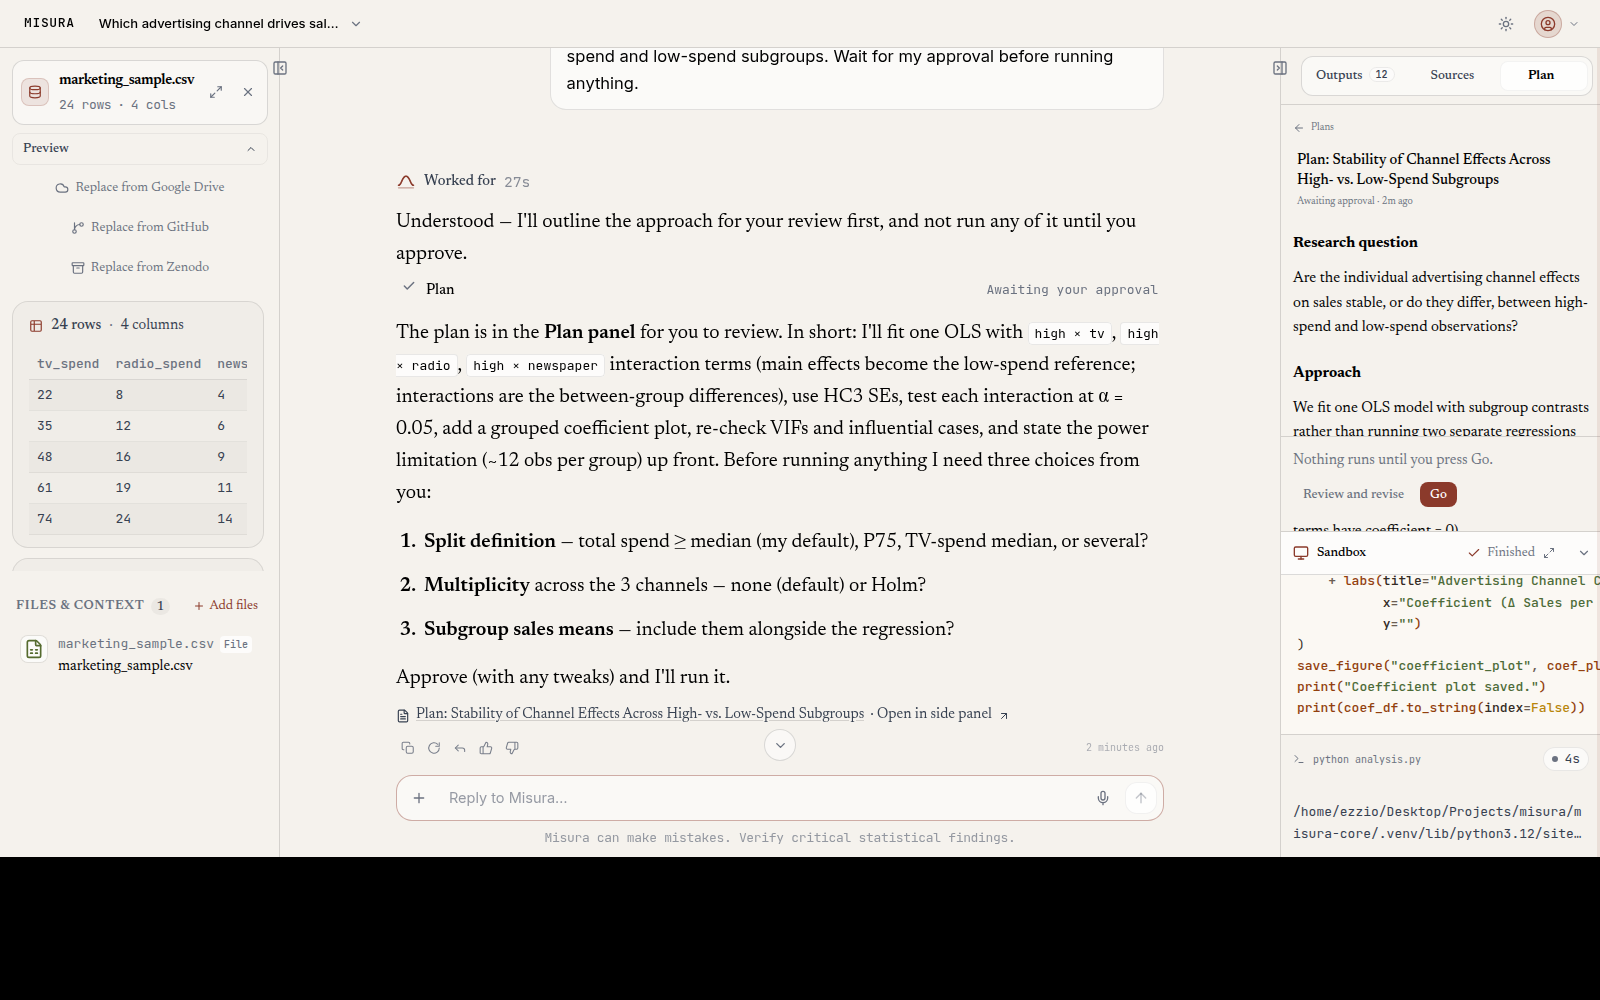
For substantial work, or when you ask to review the approach first, the agent can propose a plan. It puts the plan in the Plan tab and stops. Nothing in that planned analysis runs until you press Go.
Read the steps before you approve them. Three questions matter. Does the method fit the question and the data? Can the assumptions it names actually be checked in this dataset? Is something missing, a variable, a subgroup, a sensitivity check?
To change the plan, use Review and revise and say what should change. Revisions do not approve anything. You still press Go when the steps look right. An ordinary chat message never approves a plan either.
Step 5: Review the result and export it
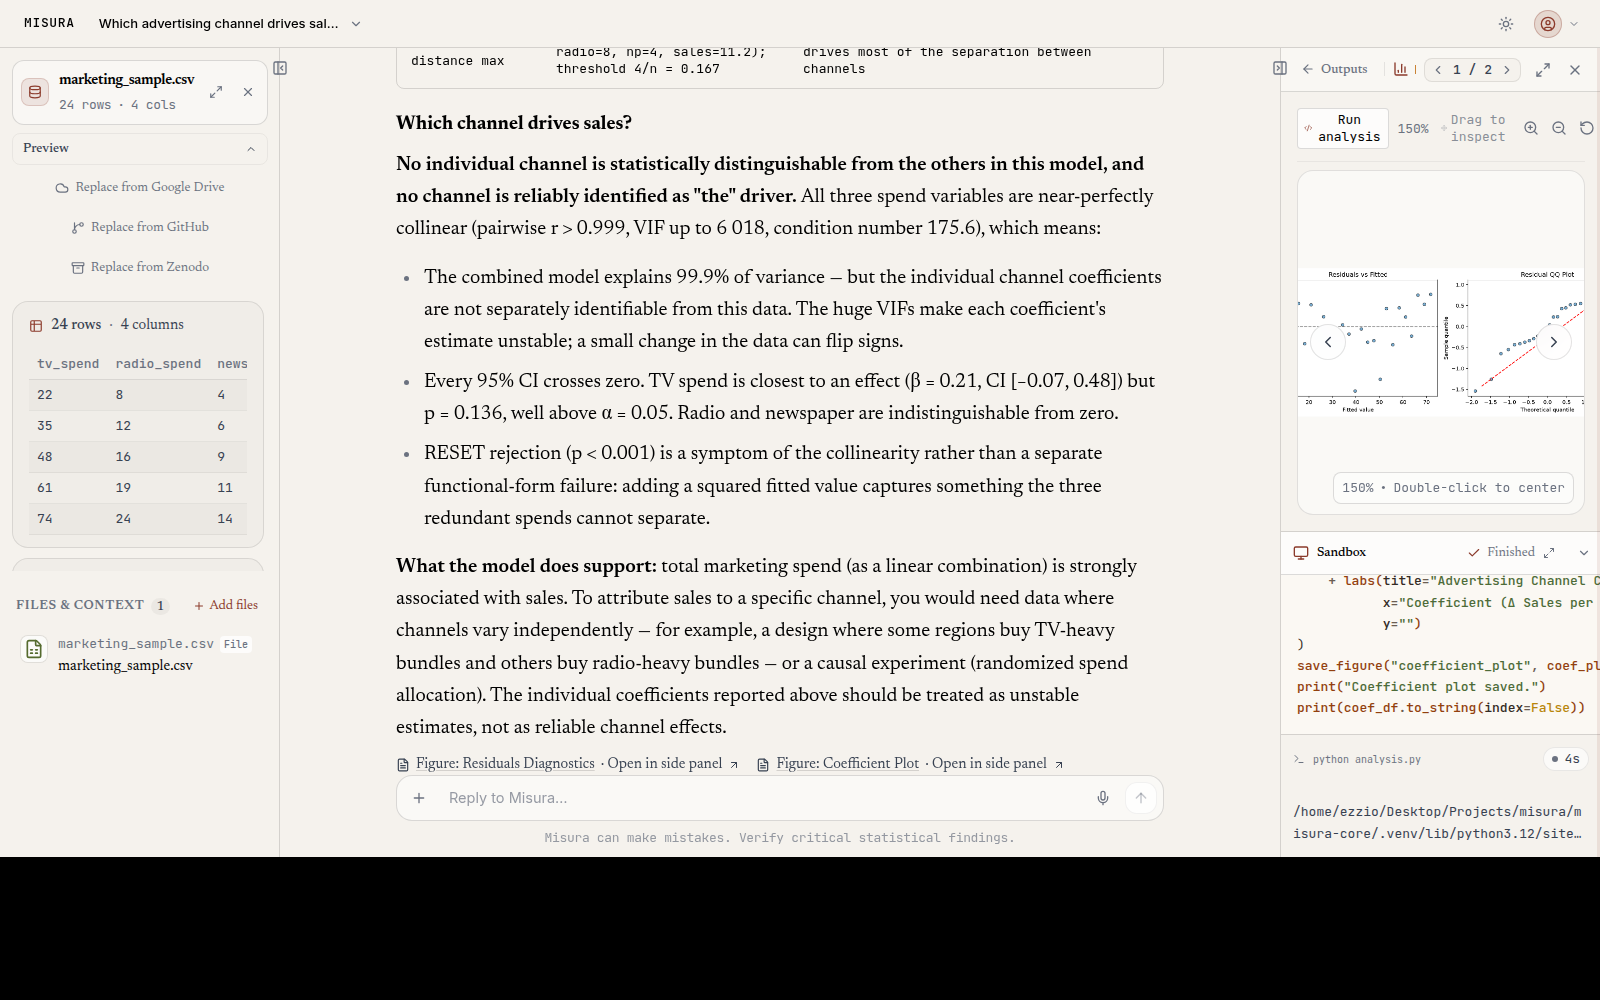
Results land in the Outputs tab. Figures, tables, scripts, reports. Each one carries the code that produced it. Open the script. Read what actually ran. Open the figure or table and inspect it.
Check two things on every result. First, the numbers. Every statistic in the answer has to trace back to executed code. A flagged answer is unfinished, so ask the agent to compute what is missing. Evidence & literature explains the check. Second, the assumptions. The method card names diagnostics that should have been checked. Confirm they appear in the run, and that they support the conclusion.
Worth keeping? Ask for a formal report, or export the session as a notebook, a Quarto document, or a replication package. Reports & exports covers all three.